A mortgage brokerage’s revenue is a function of what’s in flight, how far along it is, and how much survives to funding. Our client had every one of those facts in their loan origination system and could not get at any of them, because the system was built for compliance and document handling and exposed history one loan at a time.
Anything spanning the book — which referral sources actually produce funded loans, what commission is realistically forecast, which files have gone quiet — had to be assembled by hand into a spreadsheet, and was stale before it was finished.
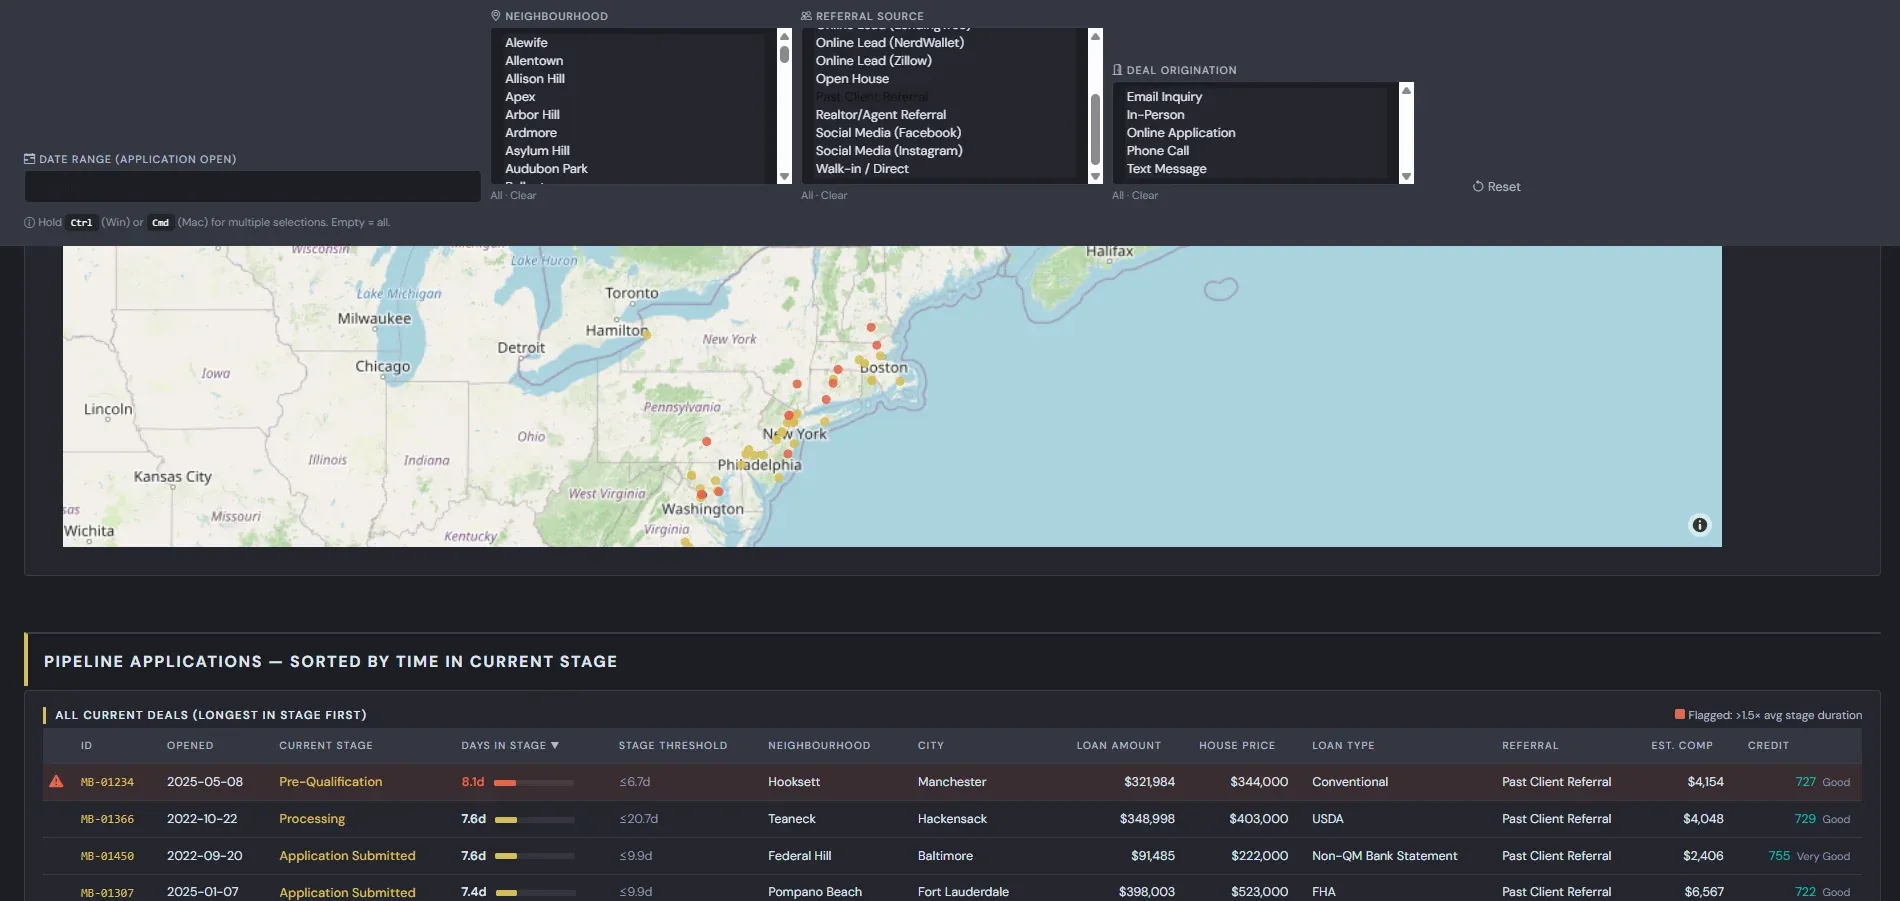
We rebuilt the pipeline as a timeline rather than a current state, and put it behind dashboards that refresh through the working day. The stalled-deal view is the one it was really built for: any active file sitting in a stage longer than 1.5× that stage’s historical average is flagged, against thresholds recomputed nightly from the funded book.
The problem underneath the problem
The obvious ask was dashboards. The actual work was modelling.
An origination database records where each file stands now and logs the milestones it passed on the way. It does not model a deal as a sequence of stages with durations, and it does not cleanly distinguish the three shapes a record can take:
- a funded loan with a complete stage history
- a fallen-out file that stopped partway through
- an active file sitting in a stage with no end date yet
Almost every question the brokerage wanted answered depends on that distinction. Average time to close is meaningless if fallen-out files are averaged in. A stalled-deal alert is impossible without knowing how long a stage normally takes. A conversion funnel needs to know not just where deals ended but every stage they passed through.
The second problem was freshness. An earlier version of this work ran from a periodic export — portable, no infrastructure, and inheriting exactly the weakness of the spreadsheets it replaced. Someone had to remember to refresh it, it was only as current as the last export, and it lived on one workstation.
That tradeoff is fine for a monthly pipeline review. It is not fine for a dashboard whose purpose is telling a broker which files need attention today, because a stalled-deal flag computed against week-old data is worse than no flag at all — it’s a flag the broker learns to distrust. Making the analytics operationally useful meant connecting to the origination database and accepting the infrastructure that comes with it.
What we built
Three decoupled layers: extraction and modelling, an authenticated serving layer, and the dashboards — which were left substantially unchanged, because the lifecycle record was designed as a contract between them.
Reading without disturbing origination
The first decision was not to query the production origination database from the dashboards. An origination system is transactional and latency-sensitive; these queries are the opposite of what it’s tuned for — full scans across the book, aggregations over milestone history, grouping on unindexed fields. Pointing analytics at it would degrade the system loan officers depend on, unpredictably, at whatever moment someone opened a dashboard.
Extraction runs against a replica instead, so no analytical query ever competes with origination traffic.
Reconstructing the stages
Extraction resolves each loan into a flat 141-field lifecycle record. The origination schema is normalized for its own purposes — borrowers, properties, loans, conditions, documents, and milestone events in separate tables — so a single opportunity is spread across all of them. Joining to one row per opportunity is what lets the dashboards filter and chart every field with no joins at read time.
The substantive work is turning an append-only event log into intervals. Milestones are recorded as transitions, not durations: a row per event with a loan reference, a type, and a timestamp. Rebuilding the ten canonical stages — Inquiry through Funded — means ordering each loan’s events, mapping the system’s event vocabulary onto the canonical set, and pairing consecutive events into intervals with a start, an end, and a duration.
Four cases needed explicit handling, and each one was a source of wrong numbers before it was handled:
- Skipped stages must be recorded as absent, not zero-duration, or they drag every average toward the floor.
- Re-opened files after a cleared condition produce out-of-order events, which naive pairing turns into negative durations.
- Files that stop with no terminal event require reading disposition rather than inferring death from silence.
- Ambiguous cases are logged rather than silently coerced.
The three record shapes are then written explicitly into the output schema. A funded loan carries all ten stage groups; a fallen-out file carries its completed stages plus a distinct failure-stage group with the stage it died in and the recorded reason; an active file carries completed stages plus a current-stage group with a start and no end.
Encoding disposition in the schema rather than inferring it downstream means the dashboards never guess — and it removes the whole class of bug where a fallen-out file quietly contaminates an average computed over funded ones.
Failures that don’t announce themselves
Geography is resolved at extraction and cached, so an address is geocoded once rather than on every refresh. This replaced an earlier approach that looked up each deal’s city against a coordinate table — which failed silently for any city missing from the table, and collapsed every deal in a metro area onto a single point, hiding exactly the concentration the map exists to show.
The same reasoning drove where the flagging thresholds live. They were originally constants in the dashboard’s JavaScript, derived once from the funded book and frozen there. Those constants drift as the business changes: a new wholesale lender with faster underwriting, a seasonal slowdown in appraisals, a change in how document collection is handled — all move the real averages while the hardcoded ones stay put. A threshold that no longer reflects reality produces alerts the broker learns to ignore.
The averages are now recomputed from the funded book on every nightly refresh and served alongside the records, so the baseline tracks the business.
Elapsed time in stage moved too. In the file-based version it was a number baked into the export, aging from the moment the file was written. It’s now computed from the stage start timestamp at request time, so time-in-stage is current regardless of when the record was last extracted.
Refresh, deliberately unsophisticated
The full book is re-extracted nightly. For a brokerage of this size a complete rebuild is faster and considerably simpler than incremental change capture, and it’s self-healing — anything corrected in the origination system is correct in the analytics the next morning, with no reconciliation logic and no drift to detect. We were deliberate about not building change-data-capture the volume didn’t justify.
The active pipeline refreshes more often through the day, since it’s the view whose value decays fastest. Active files are a small fraction of the book, so refreshing only non-terminal records is cheap enough to run on a short interval.
Serving borrower data responsibly
This is where live integration changed the deliverable most, and it had no equivalent in the file-based version.
Once the analytics carry live borrower records — names, employers, salaries, credit scores, loan terms — the dashboards stop being a convenience and become a system holding non-public personal information, with the obligations that follow.
- Served over TLS behind authentication, not opened from a local folder
- Role-scoped server-side: a loan officer sees their own pipeline, a principal sees the full book, and the endpoint enforces it rather than trusting the client — anything the browser receives is available to whoever holds the browser
- Applicant-identifying fields are omitted entirely from aggregate views that don’t need them, so charts and distributions are served from records carrying no borrower identity; identity is returned only for the record-level table and only to entitled roles
- Access logged with requesting user, scope returned, and timestamp — which is what makes it possible to answer who saw what, if that’s ever asked
- Replica credentials live in service configuration and never reach the browser; the dashboards hold no connection and no query capability, so the origination database’s attack surface is unchanged by the addition of analytics
The dashboards
Main — funded volume and forecast commission, closed-won and closed-lost counts, live pipeline by stage, outcomes by month opened, channel breakdowns across referral source, origination source and loan type, and a stage conversion funnel showing for each stage how many deals progressed versus fell out there. A geographic map plots every opportunity by outcome.
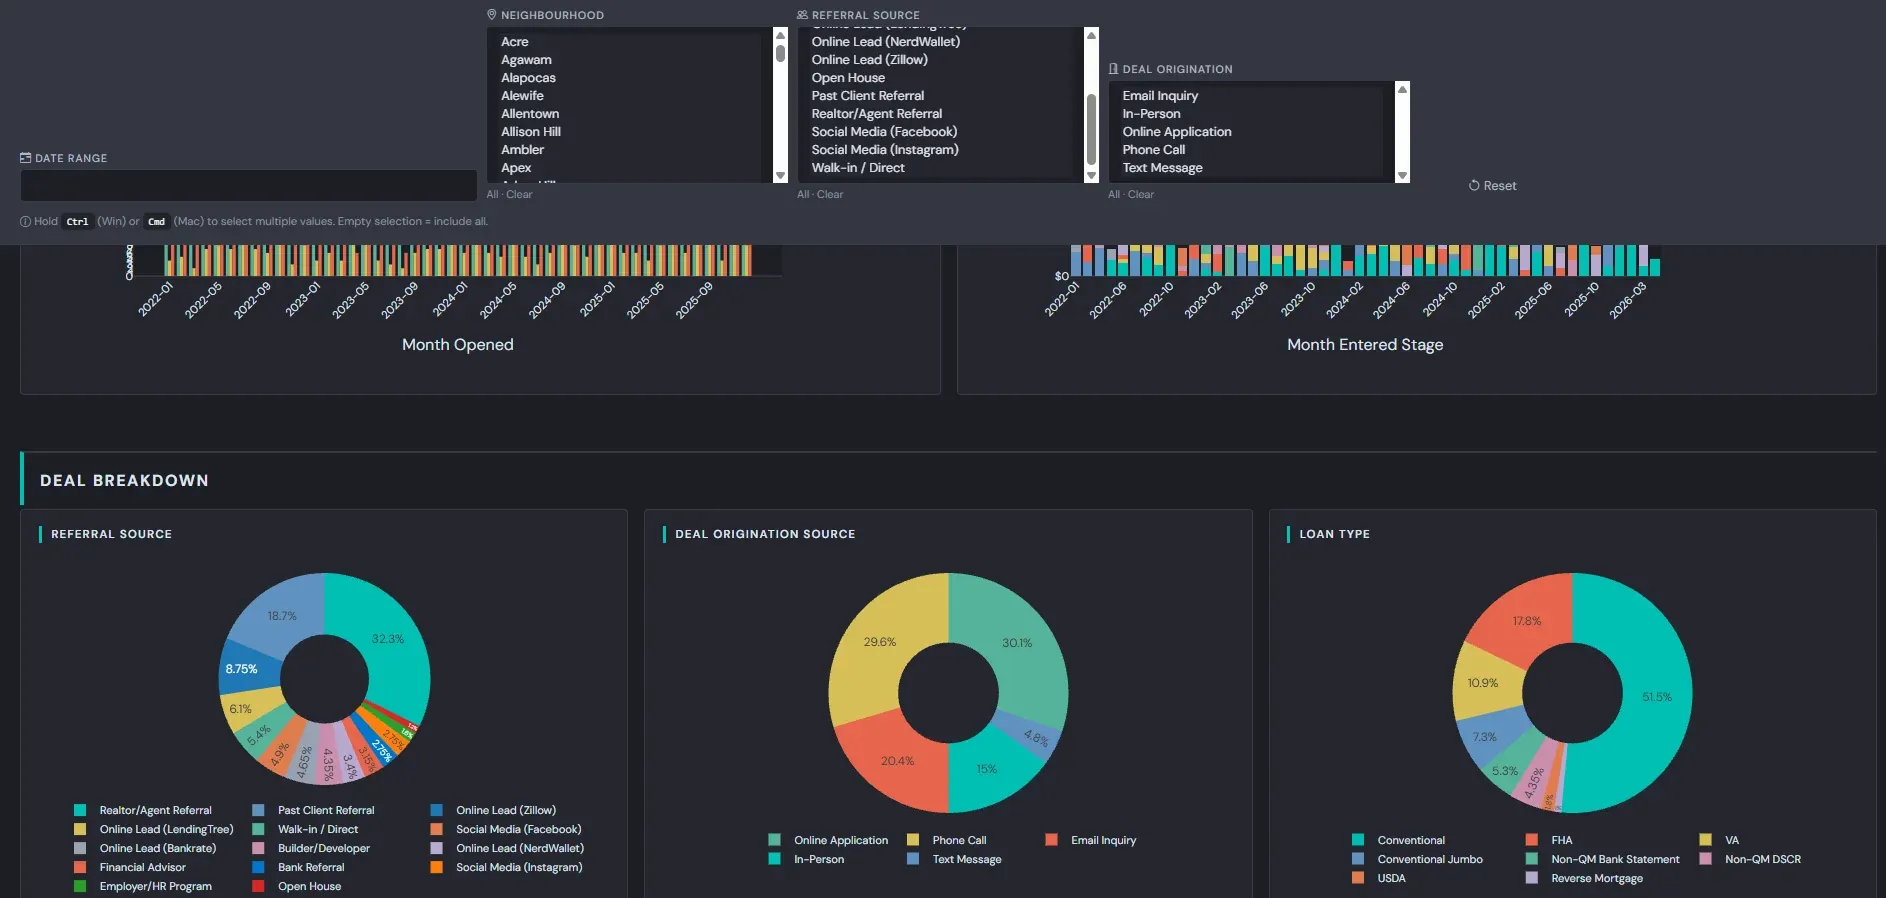
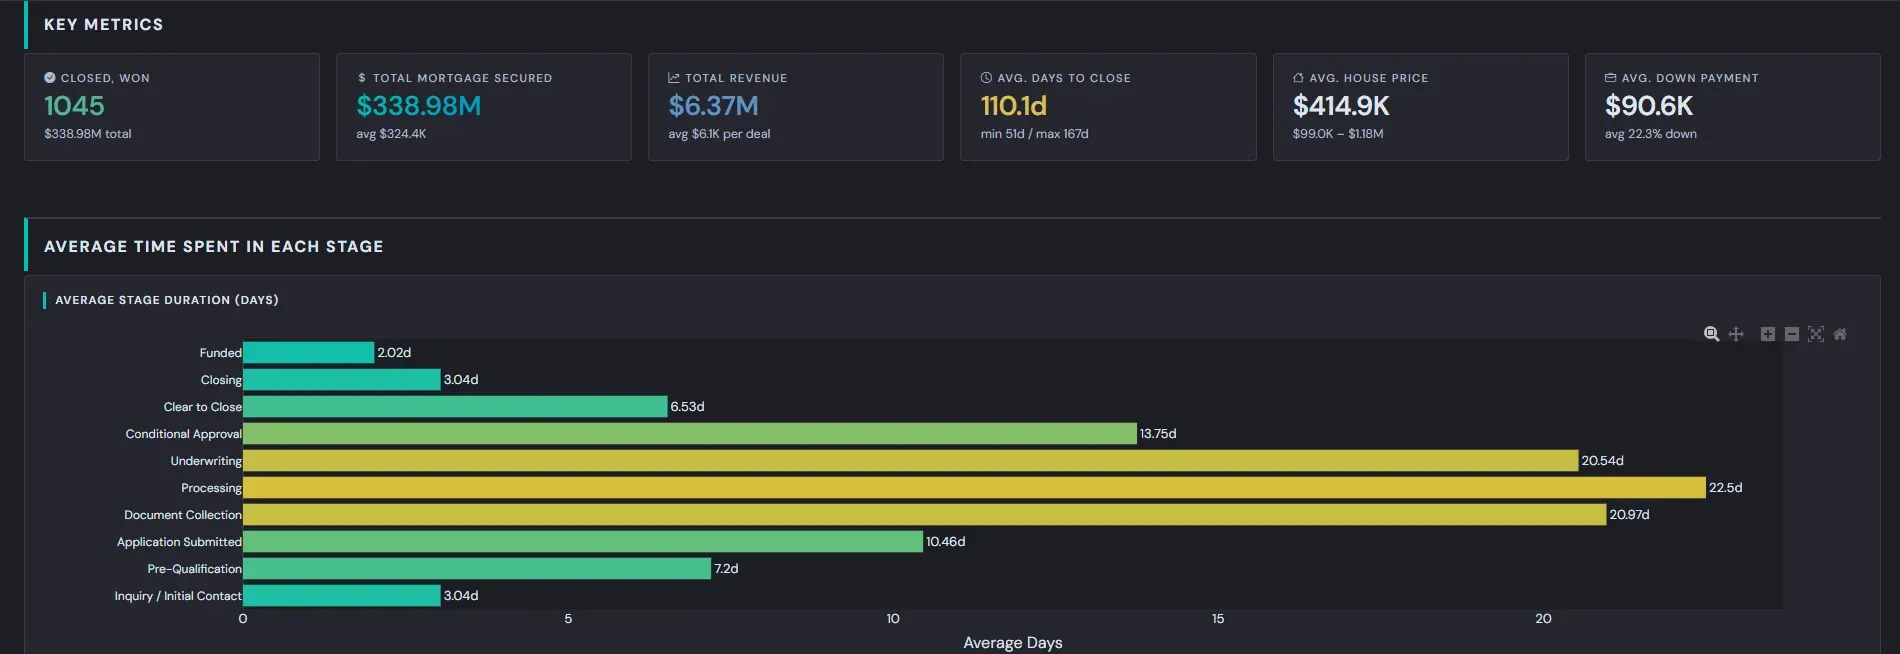
Closed-won — what a funding deal looks like: channel, campaign, loan and property type, purchase versus refinance, wholesale lender, compensation structure, rate type, plus applicant-side views on income structure, co-signers, neighbourhoods, and occupation mix. Five histograms cover financial distributions; a stage duration chart shows where time actually goes.
Current pipeline — the one the integration was built for. Files exceeding 1.5× their stage’s average are flagged, and deriving the threshold per stage is what makes the flag trustworthy: two weeks in document collection is normal, two weeks in clear-to-close is not, and a single global cutoff would either bury the second case or drown the broker in false alarms on the first. The flag propagates everywhere — warning icon and tinted row in the table, a separate red trace on the map so stalls clustering in a market or with a lender are visible, and a dedicated KPI count. The table sorts by time in stage by default.
Where the human stays in the loop
The system decides nothing. It flags files that have been sitting longer than comparable files historically did — which is a reason to look, not a diagnosis. The broker knows the file, the borrower, and the lender, and decides whether a stall is a problem or a deal waiting on something reasonable.
The design goal was a queue a broker trusts enough to work from daily, which is why so much of the effort went into thresholds that stay true and data that stays current. A flag that’s wrong often enough gets ignored, and an ignored flag is worse than none.
Tradeoffs we accepted
Direct integration gave up the property that made the earlier version easy to adopt. The file-based dashboards ran from a folder with no infrastructure, no credentials, and nothing to operate — they could be handed over and forgotten. The integrated system needs a replica, a scheduled job, a serving process, an authentication configuration, and someone to notice when the nightly refresh fails.
That’s a real ongoing cost, and it’s only worth paying because the dashboards’ value depends on currency.
So we kept the file-based export path working alongside it. It’s the fallback when the refresh breaks, and it remains the right tool for a point-in-time snapshot that needs to leave the brokerage’s network.
Results
Scoped in January 2026. The first integrated version went into production in March, and the current pipeline view has been in daily use since. Two people built it, it is still under active maintenance, and changes ship as the brokerage asks for them.
| Before | After | |
|---|---|---|
| Weekly manual reconciliation | ~83 hours across the team | Answered by a view already open |
| Pipeline stages available | None stored | 10, reconstructed from the event log |
| Median time to funding | Baseline, 12 months prior | Down 7.4%, six months after |
83 hours a week of manual reconciliation, gone
The number is the brokerage’s own count across the team, not ours, and it is the sum of four recurring exercises rather than one:
- rebuilding the pipeline spreadsheet from the origination system each week
- assembling the commission forecast from whatever that spreadsheet said
- attributing funded volume back to referral sources by hand at month end
- opening active files one at a time to find the ones that had gone quiet
All four are now answered by a view that is already open, and the fourth — the one that used to be nobody’s explicit job and therefore happened irregularly — is the one the current pipeline dashboard replaced outright.
The honest framing is that this is displaced effort rather than headcount. The time went back into working files, not off the payroll.
Ten stages that the system never stored
Inquiry through Funded, reconstructed from an append-only event log. This is the result the rest of the work rests on: every number below, and every threshold the flags use, exists because the lifecycle record makes the distinction between a funded loan, a fallen-out file and an active one explicit rather than inferred.
Median time to funding down 7.4%
Measured across funded loans in the six months after the stalled-deal flags went live against the twelve months before. Most of the movement is in document collection and condition clearing — the two stages where a file stalls because it is waiting on a person rather than on a process.
That is the result we would caveat hardest. It is not a controlled comparison: lender mix and the rate environment moved over the same window, and we make no attempt to separate their contribution from the flags’. What we can say is that the stages that improved are the ones the flags surface, and the stages that did not move are the ones nobody can hurry.
Whether the flags are trusted
In the first 90 days the current pipeline view flagged 214 active files. Roughly a third turned out to be genuinely stuck — a condition sitting unread, a document request that never reached the borrower, an appraisal nobody had chased. The rest were files legitimately waiting on something, which is the expected and acceptable failure mode: the flag is a reason to look, and a broker who looks and finds nothing wrong has lost a minute, not a deal.
The adoption signal matters more than the count. The principal opens the current pipeline view each morning, loan officers work from their own role-scoped version of it, and the Monday pipeline meeting now runs off the dashboard instead of a spreadsheet someone rebuilt on Sunday night. A flag that gets ignored is worse than no flag, and after six months this one is still being worked.
What the brokerage learned about itself
Two things surfaced that changed behaviour, and neither was on the original ask:
- A referral source producing the second-highest inquiry volume in the book was funding at well under half the rate of the next source down. It had looked productive for as long as the only visible number was inquiries. Its share of spend was cut.
- Document collection was quietly consuming more elapsed time than any other single stage, including underwriting. That is invisible when the only metric anyone has is time-to-close, and it is the finding that most directly changed how files are handled day to day.
Too early to say
Fallout rate is the number that would settle whether the flags actually save deals, and there are not yet enough funded cohorts since deployment to claim a change in it honestly. We expect to be able to say something about it after a full year in production.
What it doesn’t do
- It doesn’t forecast individual deals. Flags are relative to historical stage durations, not predictions about a specific file.
- The baseline comes from funded loans only, so thresholds describe what a successful deal looks like, not an average of everything.
- It’s shaped to this origination system’s event vocabulary. Another platform would need its own mapping onto the canonical stages.
- It needs operating. A replica, a scheduled job, and someone who notices when the refresh fails.
Stack
Extraction and lifecycle modelling in Python with pandas, running against a read replica so no analytical query competes with origination traffic. A cron schedule drives the nightly full re-extraction and the shorter intraday refresh of the active pipeline. A FastAPI service publishes the prepared records over an authenticated TLS endpoint with role-scoped access and request logging. The dashboards themselves are unchanged: single self-contained HTML files that fetch the JSON record set and do all filtering, aggregation and rendering client-side, with Plotly for charts, Bootstrap for layout and Flatpickr for date ranges. No build step.